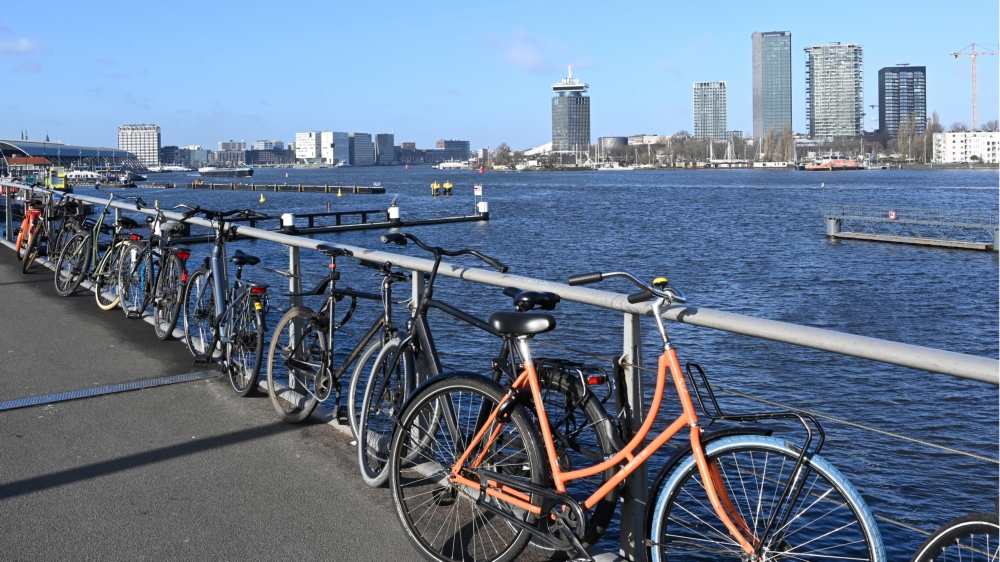
Amsterdam cyclists rank bike ride with 7.3 out of 10, but worry about road safety
On average, Amsterdam cyclists rank their bike ride with 7.3 (out of 10). That is slightly more than the 7.1 in 2021. This is one of the results of the Cycling Satisfaction Monitor 2023. Cylists quite satisfied with the network and bicycle parking, but the speed differences on cycle paths cause for concern.
For this study, almost 1,000 cyclists at twenty locations in the city completed a survey about the bike ride they just completed. This happened in nicer weather than 2 years ago, which may have contributed to the good grade.
Just like in 2021, cyclists are quite satisfied with the Amsterdam bike network, ranking it with an average of 7.2 (out of 10). Bicycle parking scored really better than before. The statement ‚I can park my bicycle easily’ was ranked with 7.2. Previously that was 6.8. The highest average score for bike parking is given at North metro station (8.4), followed by other locations with guarded bike parking facilities such as at Amstel station (8.3), at the Hallen and at Central Station (both 7.8). At Central Station, where a new large underground parking facility was opened early 2023, the rating has improved greatly: from an average of 5.1 in 2021, to an average of 7.8 in 2023. That ranking of 2021 related to the former outdoor
Road safety
The monitor shows that Amsterdam cyclists are increasingly concerned about road safety.The statement ‚I feel safe during this ride’ was ranked with an average of 7.4 in 2021 and 7.1in 2023.
The speed differences and overcrowding on cycle routes in particular are cause for worry for many cyclists. As a result, a majority of the cyclists in the study report feeling less safe than before: 66 percent, and among women even 73 percent.
Four out of five participants in the study are in favour of introducing a maximum speed (of 25 km/h or less) on cycle paths.
More than half (54%) of the cyclists surveyed find it busy or very busy on the cycle paths.Cyclists who thought it was busy on their bike ride gave their ride on average a lower score than cyclists who found it not busy.
Large differences in speed
In addition to the cycling satisfaction survey, the municipality also had the speeds of cyclists
investigated. This shows that there are considerable speed differences:
– The average speed of all bicycles together (without distinction between electric and regular bicycles) was 19.6 km/h. 5% of cycle path users rode slower than 12.2 km/h,5% went faster than 29 .0 km/hour
– Of the bicycles that could be determined to be an e-bike with certainty, 41% cycled faster than 25 km/h.
– As in previous research (by the Ministry of Infrastructure and Water Management and the Amsterdam Cyclists‘ Union), it appears that a large proportion of e-bike riders ride faster than 25 km/h (the speed at which power support should legally stop).
Higher speed?
It is hard to tell whether speed differences are increasing, because these measurements have not been done before. The ministry’s research did show that the average cruising speed of e-bikes appears to be increasing: from 23.7 km/h in 2022 to 24.2 km/h in 2023. This research was conducted on 18 cycle paths in the Netherlands. major cities and at 2 recreational locations.
Overtaking bahaviour
Whether the speed differences actually lead to more conflicts on the cycle paths is not yet clear. Engineering firm DTV investigated this on 9 road sections of 50 meters long in Amsterdam during 7 hours. This limited observational study showed that crowding and overtaking only sporadically led to ‚really unsafe traffic situations‘.The municipality notes that ‚cyclists can certainly feel unsafe and that anticipating to so many other cycle path users
can ask a lot of cyclists.‘
The studies mentioned above were carried out for the new Road Safety, Pedestrian and Bicycle Implementation Plan. All studies together can be found here.


